1. Daily whole Sun prediction of > 10 MeV > 10 pfu proton events (2010-2019)
Solar Energetic Particle events (SEPs) are among the most dangerous transient phenomena of solar activity. As hazardous radiation, SEPs may affect the health of astronauts in outer space and adversely impact current and future space exploration. In this paper, we consider the problem of daily prediction of Solar Proton Events (SPEs) based on the characteristics of the magnetic fields in solar Active Regions (ARs), preceding soft X-ray and proton fluxes, and statistics of solar radio bursts. The machine learning (ML) algorithm uses an artificial neural network of custom architecture designed for whole-Sun input. The predictions of the ML model are compared with the SWPC NOAA operational forecasts of SPEs. Our preliminary results indicate that 1) for the AR-based predictions, it is necessary to take into account ARs at the western limb and on the far side of the Sun; 2) characteristics of the preceding proton flux represent the most valuable input for prediction; 3) daily median characteristics of ARs and the counts of type II, III, and IV radio bursts may be excluded from the forecast without performance loss; and 4) ML-based forecasts outperform SWPC NOAA forecasts in situations in which missing SPE events is very undesirable. The introduced approach indicates the possibility of developing robust ``all-clear'' SPE forecasts by employing machine learning methods.
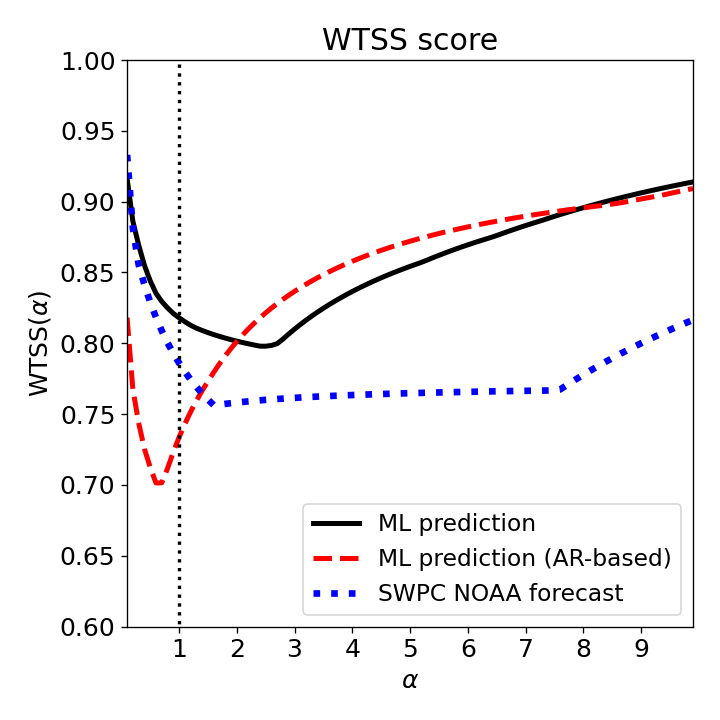
Figure caption: the Weighted True Skill Statistics (WTSS) as a function of a weighting parameter α for ML-based predictions using all characteristics (black solid line), using SHARP characteristics of ARs only (red dashed line), and calculated for the SWPC NOAA probabilities (blue dotted line). The vertical black dotted line corresponds to α=1 case, when WTSS(1)=TSS.
2. Catalog of > 10 MeV > 10 pfu proton events (1986-2019)
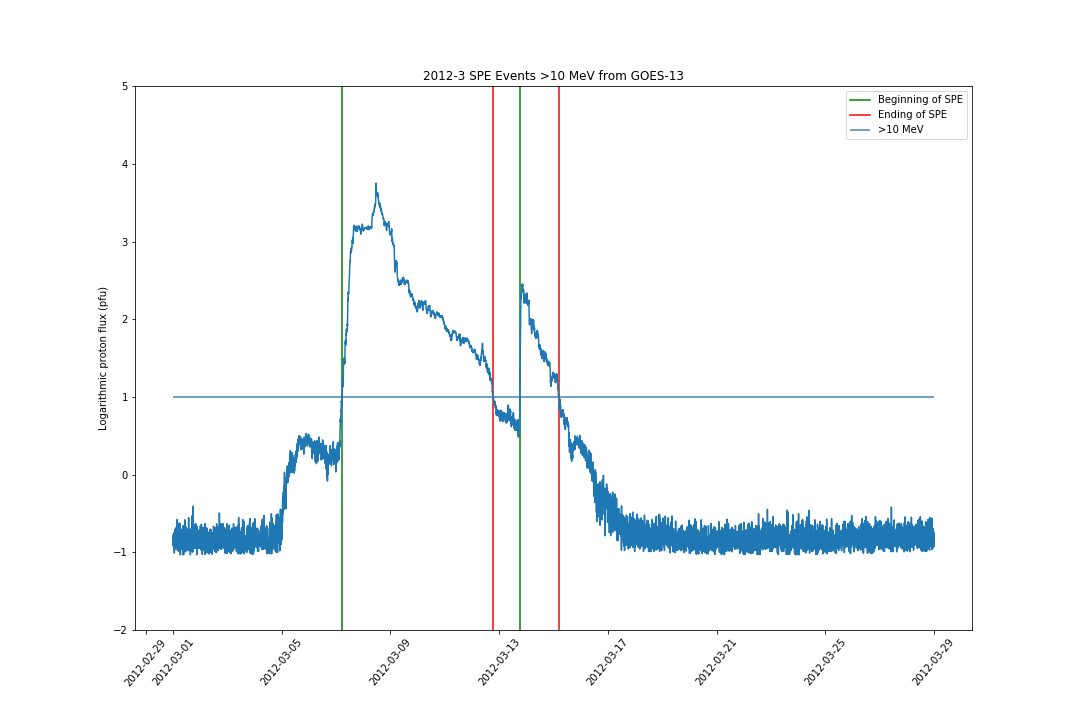
Catalog of > 10 MeV > 10 pfu proton events (1986-2019) detected by individual GOES satellites (EPS and EPEAD detectors). In case if the data are incomplete, or the event has a short duration (marked as oscillation), this is reported in comments column. The spike records are removed from the event list.
Figure caption: the flux of > 10 MeV protons for March 2012, and the detected proton events.
3. Catalog of daily statistical features of GOES observations (1986-2019)
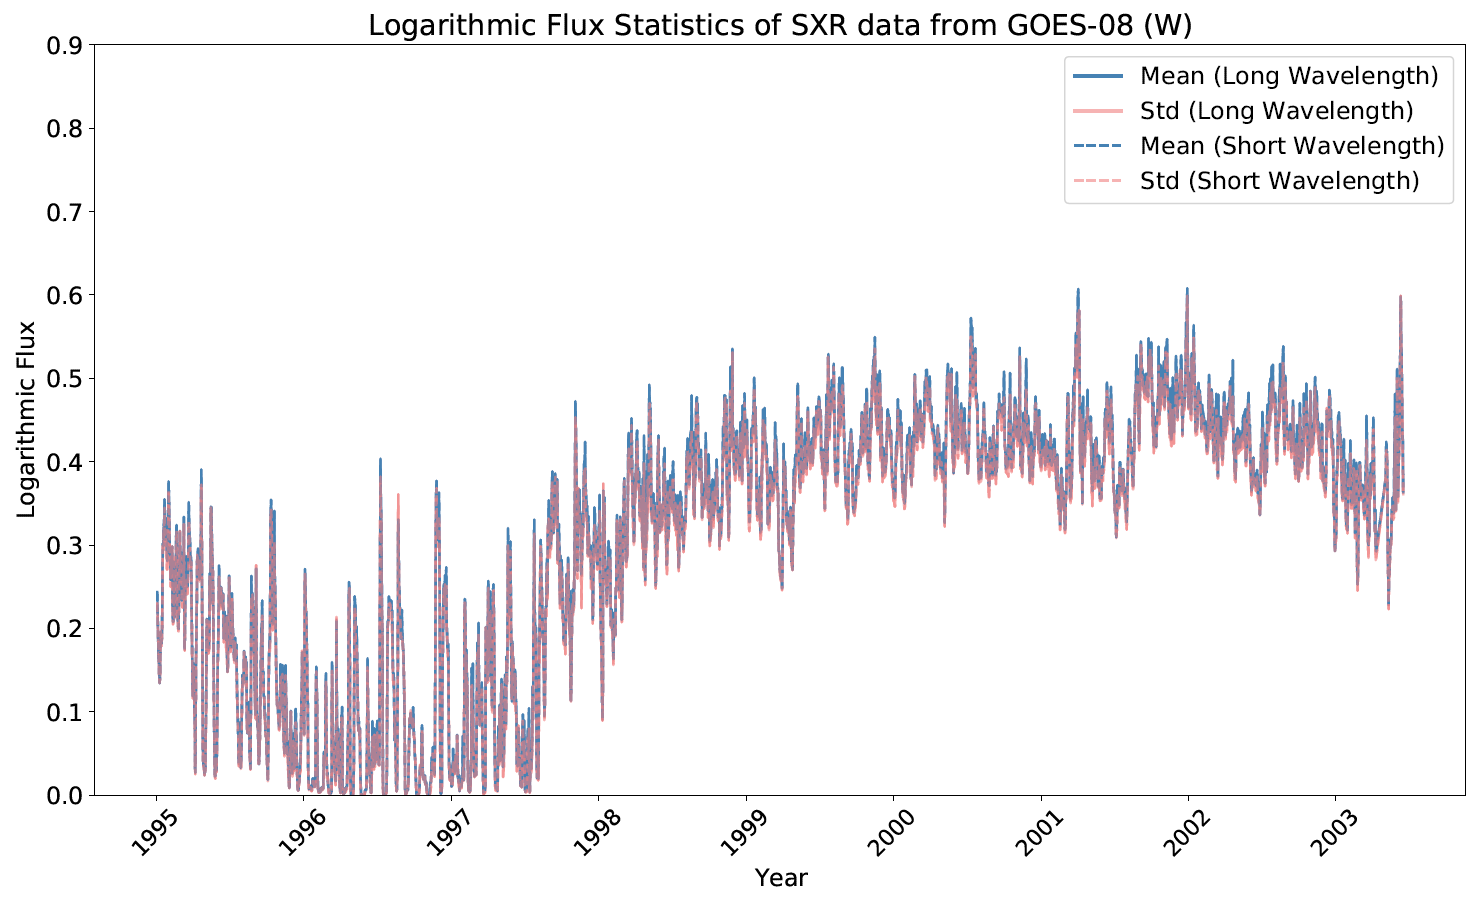
Catalogs of daily statistical features (1986-2019) for the individual GOES satellites/detectors (EPS, EPEAD, and XRS detectors). The statistical features include the mean, mediam, minimum, maximum daily values of the fluxes, as well as their daily standard deviation, skewness, and kurtosis.
Figure caption: daily mean values and standard deviations of the Soft X-ray fluxes observed by GOES-08.
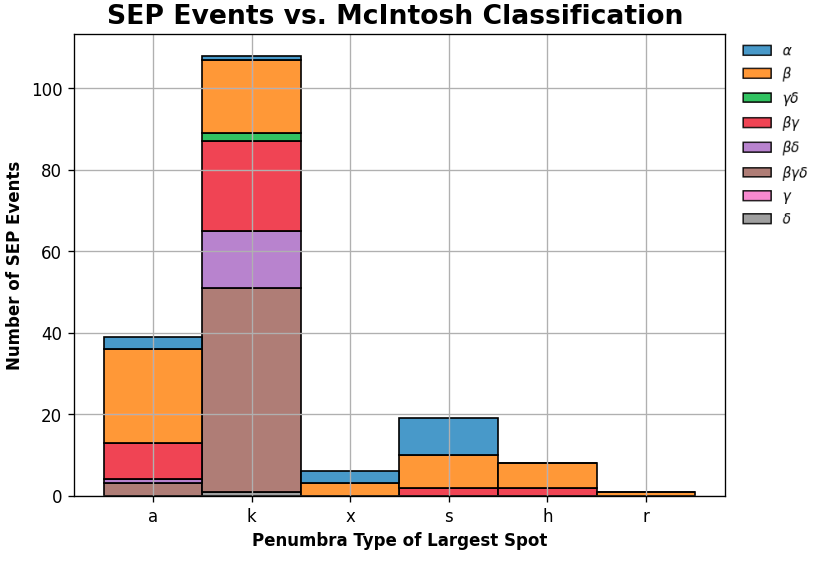
4. Catalog of McIntosh and Hale Classes of Active Regions and Associated SEP Events (1981-2021)
A homogeneous 40-year-long period data set of Hale and McIntosh classes of active regions and associated SEP events spanning from December 1981 to December 2021, which covers the declining phase of SC21, SC22-24, and the rising phase of SC25. The list of active regions associated with SEP activity is presented in addition.
Figure caption: the number of SEP events produced by ARs classified by the second component of the McIntosh classification scheme. The legend shows the Hale classifications and the contribution of Active Regions (ARs) in a respective Hale class to the total number of SEPs in each bin.
5. Data set of TEBBS properties of soft X-ray solar flares and associated SEPs (2002-2017)
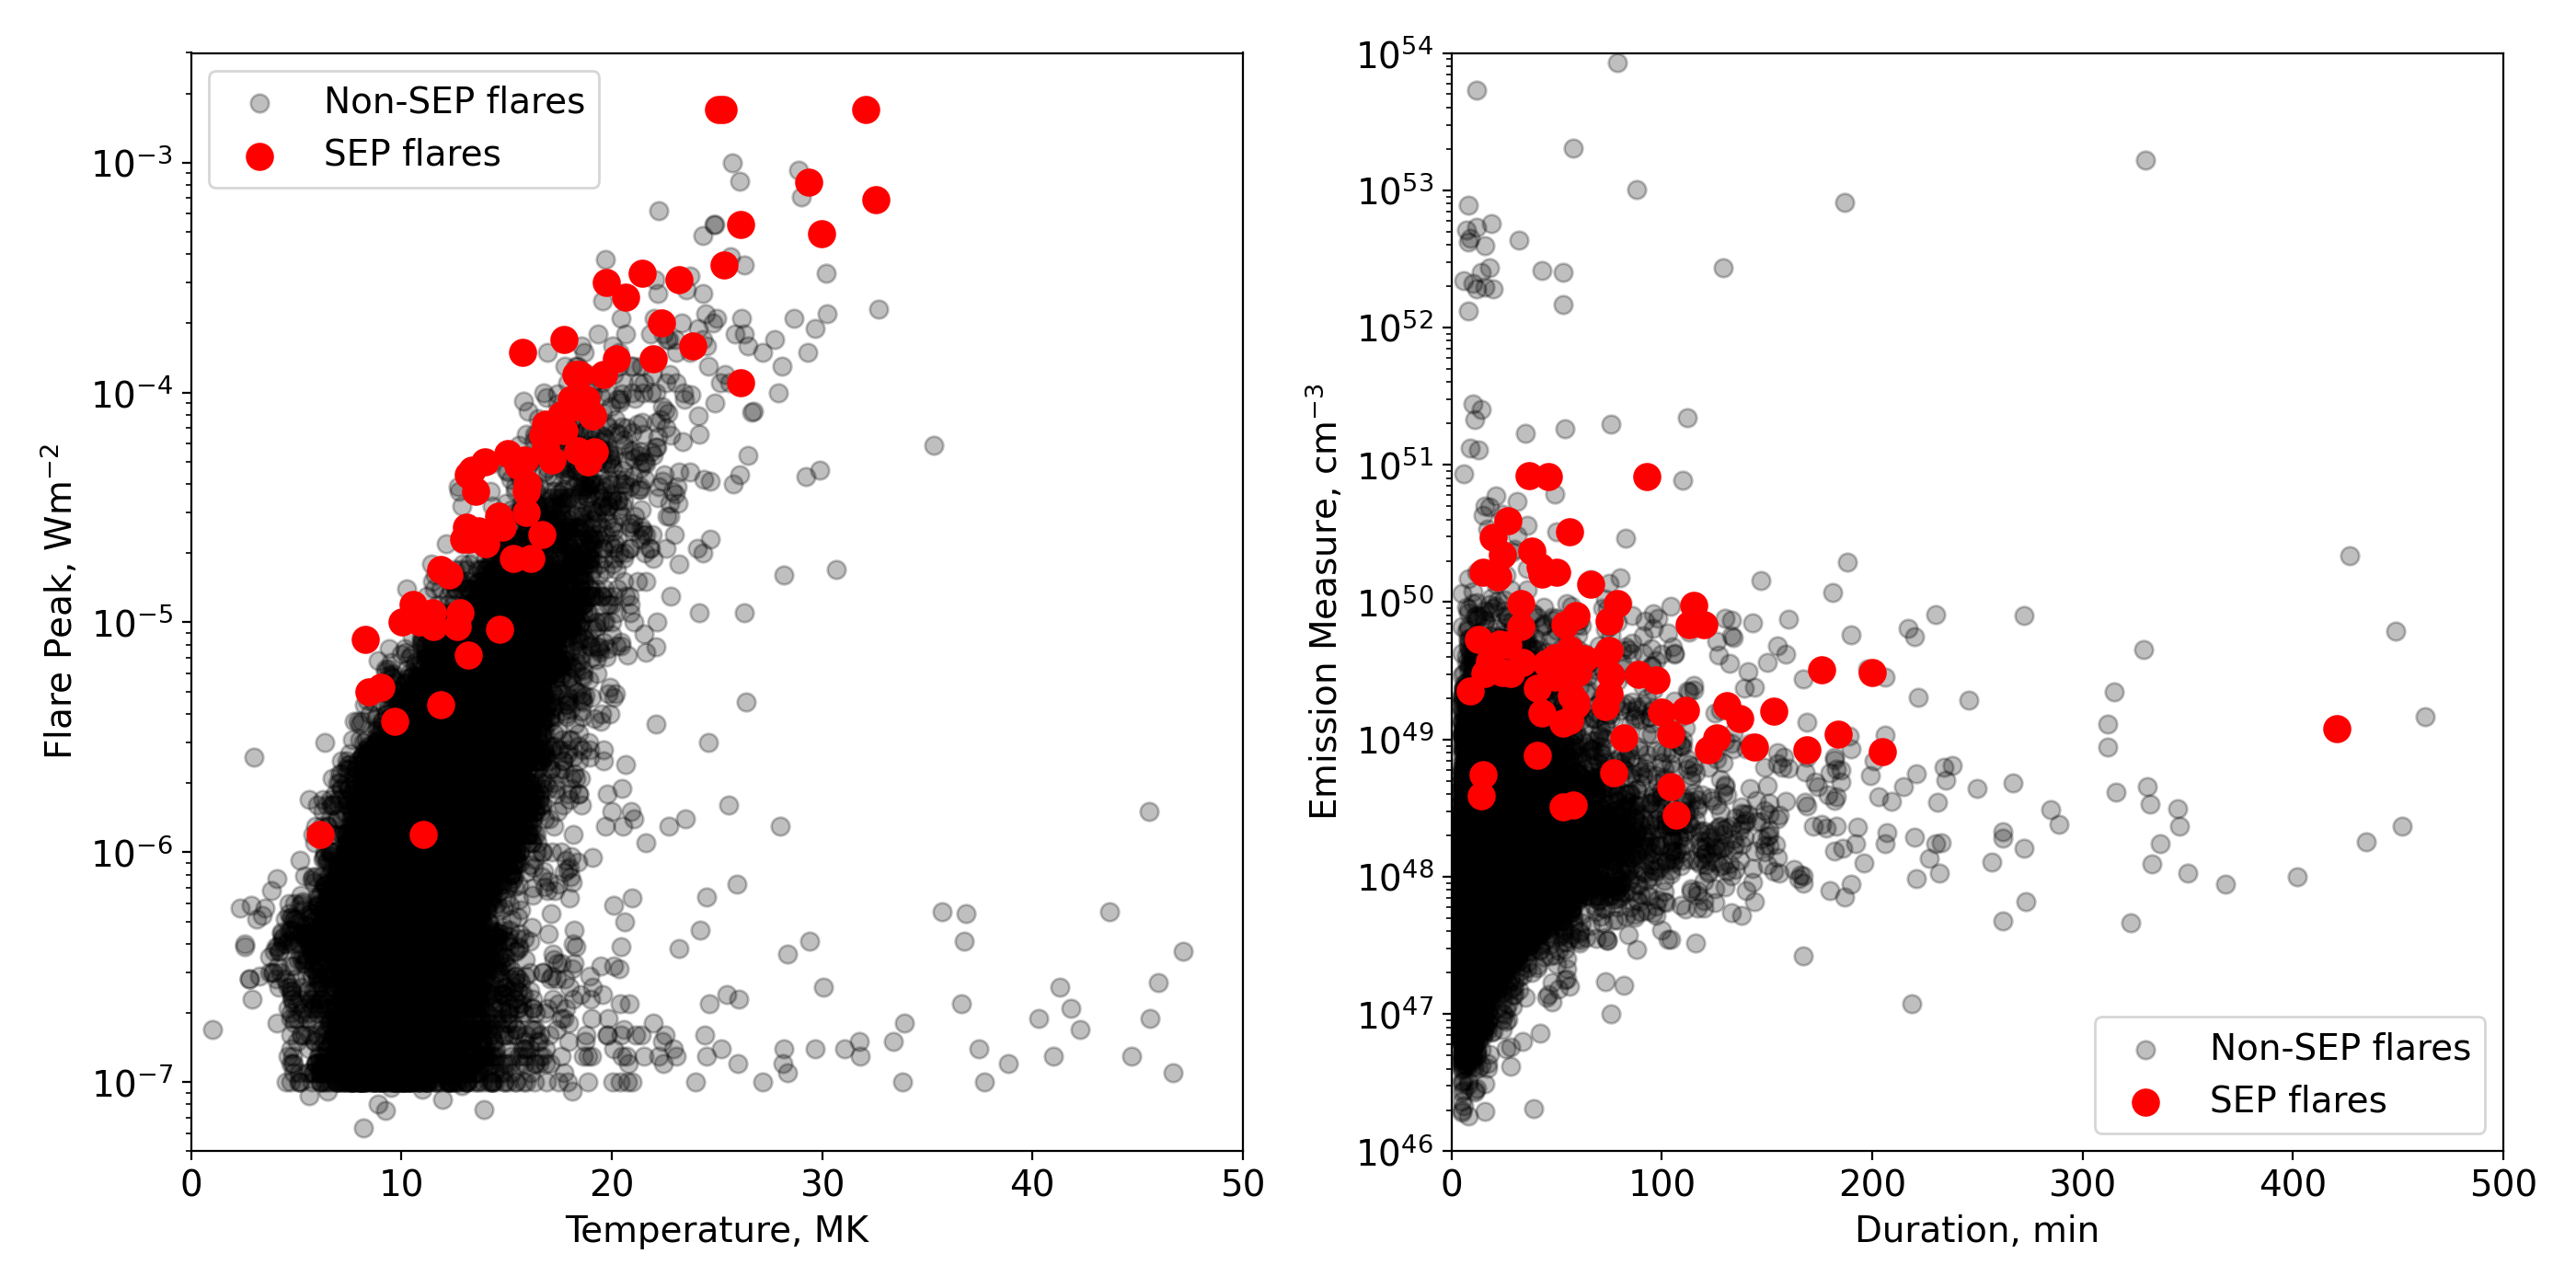
Data set of the soft X-ray flares observed by GOES satellite during 2002-2017 with their properties calculated using Temperature and Emission Measure Based Background Subtraction algorithm (TEBBS, Ryan et al. 2012). The data set includes the label indicating association of the flare with the SEP event (True or False). Notice that the start and end times in the data set correspond to the flare but not the SEP event.
Figure caption: distribution of the flare peak emissions at 1-8A and flare peak temperatures (left), and flare durations and peak emission measures (right). Solar flares that did not result in the following SEP event are marked in black, and that resulted are marked in red.